
Dive deeper with student performance data
Looking to more closely analyze students’ strengths and weaknesses? We’ve added new features to the Student Performance page to help you improve instruction. You can find your Student Performance page under “My Classes.” Read below to learn more about these additions.
The three new charts on this page show student performance by standard, literary and informational lesson averages, and assignment averages over time. You can use these tools to become a master at assessing student needs, and identifying which students need extra support, and in what.
1) Track student performance by CCSS
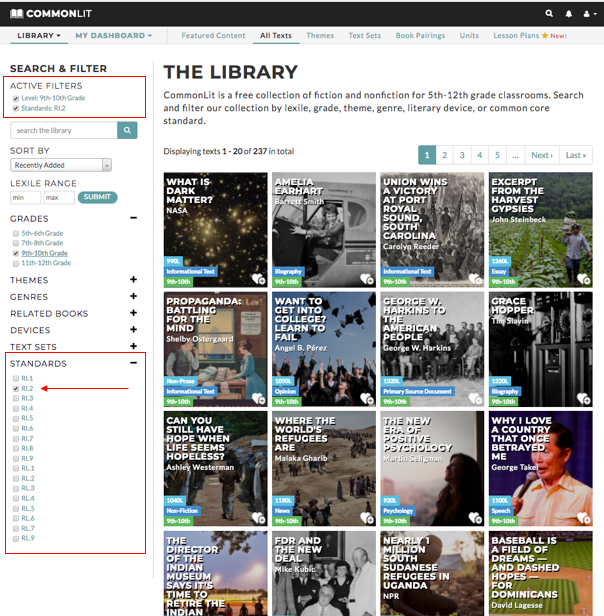
Now you can view student performance by Common Core State Standard (CCSS) for both literary texts (RL.1–10) and informational texts (RI. 1–10). This chart aggregates data on every question answered for a particular standard and allows you to visualize the overall results by hovering over each row.
For example, let’s say you notice that your students have completed 42 total questions tagged with the RI.1 standard and got them wrong 35.7% of the time. What does this mean?
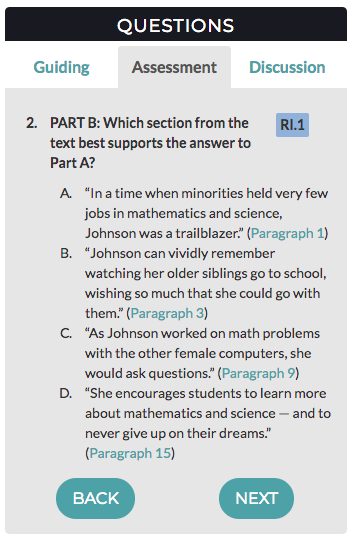
Standard RI.1 is about finding relevant evidence to support a claim. Here’s an example of a RI.1 question from NASA’s biography, Who is Katherine Johnson?:
If you want students to practice more RI.1 questions, you can search for lessons that focus on this standard. Simply filter through the CommonLit library to sort texts by standard.
2) Track student performance on informational texts versus literary texts.
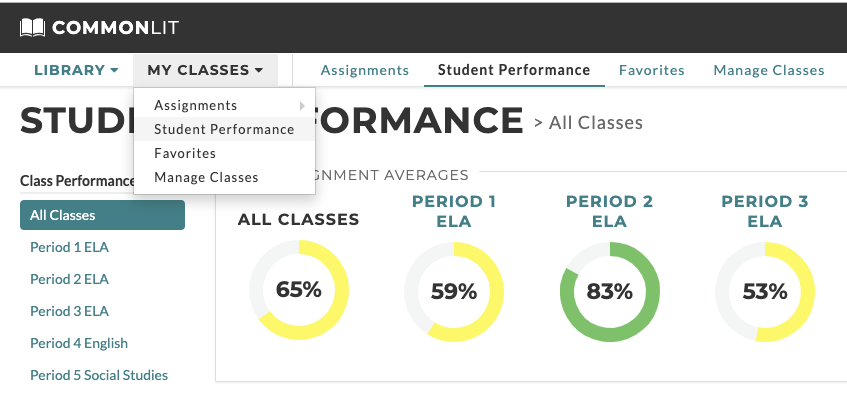
To be prepared for college, students need to be able to read and comprehend both literary texts and informational texts. To get the most out of CommonLit, we recommend assigning a balance of informational texts and literary texts so that students get ample exposure working through both types! On the Student Performance tab, you can see the breakdown of your whole class’ performance by looking at this chart:
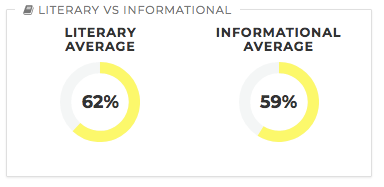
Teachers tell us that they love showing this chart to the whole class as a motivation tool! We’ve even heard of teachers using it for competitions between class periods.
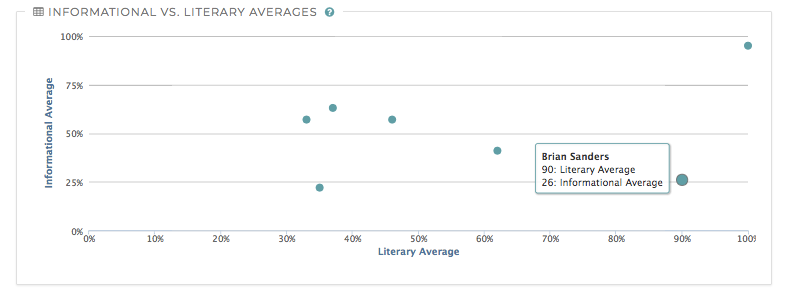
Recently, we made a chart that allows you to take this analysis to the next level. The Informational vs. Literary Averages Chart (shown below) provides teachers with a scatter plot where each dot represents a student average on informational texts versus literary texts.
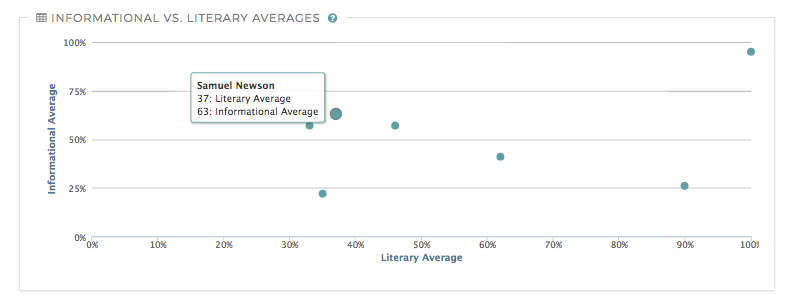
The chart draws its data from students who have completed at least 1 literary and 1 informational assignment. In this example, Samuel has a 63% average on informational texts, and a 37% average on literary texts.
So, how can you use this chart? First, you can use it to look at class-wide trends. You can also use individual student data to decide what type of article — informational or literary — you should assign as personalized homework or group work.
For example, looking at the chart below, you can see that Samuel and three of his peers are performing below 50% on literary texts, so you might want to give them a small group assignment with a short story or poem that’s topically related to your unit. Talk about being data-driven!
3) Track student progress over time
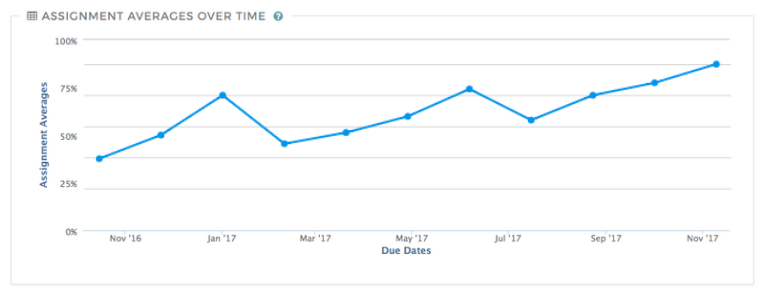
You might often wonder: Are my students getting any better at their CommonLit assignments? Our Assignment Averages Over Time line chart is here to help you answer that question!
Here’s how it works: Each dot on the chart represents a due date when students have submitted at least one digital CommonLit assignment through the platform. You can hover over each dot to see a breakdown of each assignment name, due date, class, and average.
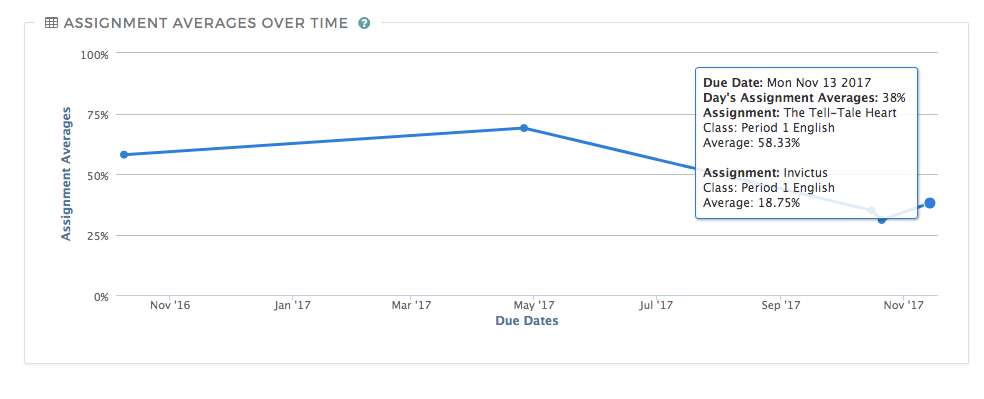
Ideally, you’ll want to see a line that progresses upward and to the right over the course of the school year on texts that become increasingly more difficult. If you notice an unexpected dip in student performance from one assignment to the next, don’t panic. This chart doesn’t take text difficulty into account. Be sure to check out whether those assignments were at a higher level than usual or in a new genre students might not be familiar with.
You can use this chart to be strategic about what type of lesson to assign next. If students are doing well, consider assigning a harder lesson next time.
Next Steps
- Check your Student Performance page often to decide what your next lessons should be and how you can use CommonLit assignments to maximize student reading growth! If you already have a CommonLit account, you can check out your student performance today.
- Got a creative idea for how to use this data? Please share your strategy with our teacher community in the comments section below.
- Want more ideas? Check out Leveraging the Guided Reading Mode, Making Meaning Out Of Standards Performance Data, and Tips for Using CommonLit’s Individual Student Performance Page.
- Finally, if you are an administrator looking to leverage similar data at a wider school level, check out our Assessment Series.